Election Fraud Lies: Georgia Election Data Shows 17,650 Votes Switched From Trump to Biden
This Election Fraud Lie uses the same type of flawed analysis of time-stamped election result feeds as the Virginia "switch" and other phony claims did. This particular form of "analysis" is very popular with Election Truthers because it can be couched in "scientific" terms and fed through the rightwing lie multiplier of far-right blogs even though it's based on a fundamental misunderstanding of election data feeds.
The Lie
Georgia election data indicates 17,650 votes were switched from President Donald Trump to Democratic presidential candidate Joe Biden, data scientists testified on Wednesday during a state Senate hearing.
A team led by Lynda McLaughlin, along with data scientists Justin Mealey and Dave Lobue, presented the results before the Georgia Senate Judiciary Subcommittee on Elections.
...
“What we have here is we actually have fraud that we can prove in this election, there was fraud in Georgia’s election, we can prove it with data,” Mealey said. According to their analysis on time series election data which was published online as early as Dec. 24, Trump’s votes were decrementing in various counties instead of increasing as they do normally.
Source: The Epoch Times
The Rebuttal
There are two flaws in time-series election analysis. The first is a matter of location. The second is a matter of source.
The Zulu's Revenge
The "proof" underlying time-based "evidence" is based on data feeds provided by multiple sources on election day. First, here's the Virginia anomaly that provoked this breathless report from an election "expert":
Software glitch going on here in Virginia.
4.42am - "We've counted 3,368,181 votes!"
5.12am - "Wait, no, we've only counted 3,199,165 votes"

Notice that the total vote count on this feed from Edison Research (eevp_source="edison") DID decline. Oh, Noes! Votes were stolen from President Trump!
But wait! Look at the vote_share columns. Votes were removed from the DEM (Biden), not from the REP (Trump). In other words, an earlier data entry error that incorrectly assigned a batch of votes to Biden was reversed. The incorrect votes were removed from Biden's total, as reflected by the drop of 4.2% in his share of the vote between 5:07 and 5:12.
Also notice the time of the correction — 5:12:38 AM. This is indubitably one of those wee hours of the morning Democrat cheats, amirite? Well, no. Look closely at the times in the image. See the letter 'Z' at the end? That means the time zone is Greenwich Mean Time, or 5 hours later than Virginia time. So the "mysterious" event took place around midnight Virginia time, not the wee hours.
Here's how Lynda McLaughlin and her merry band (oh, did I mention that Lynda is a talk radio news producer for iHeart Media, formerly Clear Channel, which declared bankruptcy after Bain Capital — yes, Mitt Romney's old firm — loaded it up with debt) determined that Georgia switched votes from Biden to Trump:
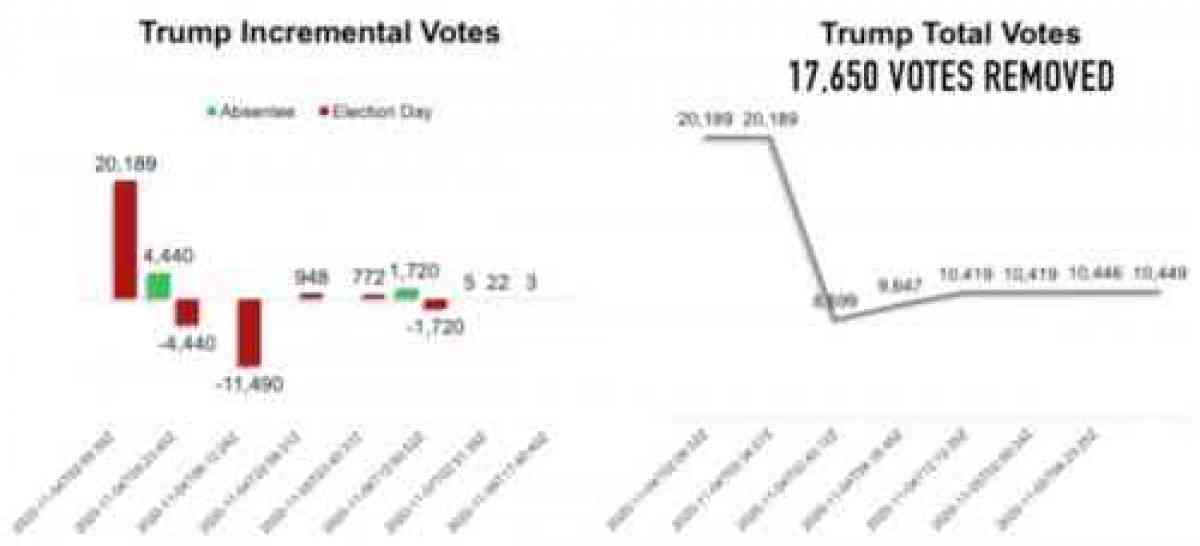
Look at the timestamp on this blatant "vote steal" (please ignore how the times on the left and right charts are very different even though they concern the same events; that's just Dumbocrat subterfuge) — and you'll see that this is part of the already debunked 3am vote swipe. That is, 3am Zulu, which means 10pm Eastern on election night, November 3rd.
What actually happened was that a data entry mistake that had given Trump 17,650 erroneous extra votes was detected and corrected. And depending on which chart you believe, this happened at either 3:23 AMZ and 6:12 AMZ (Left Twix) or 2:34 AMZ and 2:40 AMZ (Right Twix). Keeping in mind that Georgia time is 5 hours earlier than Zulu time.
Dueling Data Feeds
The fundamental flaw in these febrile fraud fantasies is that the data feeds used in the so-called "analysis" are NOT official election results. They are NOT data feeds from actual voting machines. They are NOT real-time reports of verified vote counts.
Instead, they are numbers collected and combined from thousands of sources by either the Associated Press (AP) or Edison Research using thousands of paid stringers and unpaid civilian volunteers. After the numbers are gathered by thousands of people, human data entry clerks input them to the news network feed files for distribution to news organizations. Those are the numbers you see on TV and in other media.
For example, NPR, Fox News, NY Times, etc. use AP data while ABC, CBS, CNN, and NBC use National Election Pool (NEP) data. The two data sets vary due to collection methods and policy. That's why results and declarations of winners vary. It helps explain why Fox called Arizona for Biden just after midnight on election night while NBC didn't call Arizona until 10 days later on November 13th.
The NEP data is collected by Edison Research. Edison provides NEP results for all statewide races and House races. Statewide races include the presidential and senatorial races as well as governors and other statewide offices. Edison also conducts the exit polls used by NEP.
Here's how Edison Research describes its process:
Election results reported on the news is data that comes directly from Edison Research. We have reporters in the field and members of our web team collecting and entering data throughout the night.
Results come in from a variety of ways on election night:
• Reporters at county election offices who call results into our phone centers
• Data feeds provided by some states and counties
• The Web Entry Team (crowd-sourcing) to enter results from county officials or that are
posted on state and county websites
Here's how AP describes its process:
Instead of relying on crowd-sourcing or vulnerable technology, our 50-state network of 4,000 local reporters have first-hand knowledge of their territories and trusted relationships with county clerks and other local officials. These stringers collect votes at a local level. We also gather results from state or county websites and electronic data feeds from states.
Conclusion
The "analysis" by the "experts" contains timestamp errors. This alone casts serious doubt on the entire presentation given to gullible Republicans in the Georgia legislature.
The coup de grâce to the entire "report" is that the vote counts used in the "analysis" by the "data scientists" are NOT OFFICIAL RESULTS and are NOT LIVE DATA FEEDS. They are numbers collected by thousands of onsite reporters and by thousands of citizen journalists.
The numbers are then entered into the feed software by human data entry clerks at AP and Edison. The data feeds are then uploaded to the media for presentation to the public on big-screen monitors and scrolling news tickers.
Most importantly, when an error is detected by the quality assurance and crosscheck teams, the data feed is corrected by adding votes to or subtracting votes from the affected candidate(s) in subsequent entries. It is these subsequent corrective entries that the liars use for their phony fraud claims.
Sadly, Election Truthers are naïve enough to fall for the phony fraud claims.
And it should be noted that election results aren't certified and Electoral College votes aren't cast based on AP and Edison Research election data feeds. That would be insane.
There was no vote switching that stole the election in Georgia or other states. There is not even a shred of proof of election fraud in the phony report manufactured by this bunch of unskilled amateurs with no discernable knowledge of election data feeds or talent for analyzing data.

Comments
The difference is
that actual scientists use data to build a conclusion while the average numbnuts has a conclusion that he/she fervently believes and uses data, any data even that which isn't, to build a narrative that seems to confirm their conclusion. The processes are exact opposites and even the label scientist isn't supported by expertise but only belief/faith and an empty claim to expertise. Regrettably I wish only the right was guilty of these intentional deceptions. It's another example of the triumph of belief over proper analysis and process.
Good catches, excellent analysis edg.
"Ah, but I was so much older then, I'm younger than that now..."
Reading your election lies series puts me in mind
of Leonard Pinth-Garnel's "Bad Ballet" and "Bad Playhouse".
"And now, Bad Election Analysis with EdG ..." and then we all watch along with you, in horror. I think each of your essays should conclude with the simple one-word sentence, "Excruciating."
The earth is a multibillion-year-old sphere.
The Nazis killed millions of Jews.
On 9/11/01 a Boeing 757 (AA77) flew into the Pentagon.
AGCC is happening.
If you cannot accept these facts, I cannot fake an interest in any of your opinions.
no comment, let this speak for itself
https://www.euronews.com/live
Fine. Whatever.
Since you kicked the stuffing out of that, I'm sure that since
it will be no problem at all to explicate what's wrong with this report that, well, claims there was vote switching in Georgia.
Much the same as was observed in a number of states in the 2012 Republican primary cycle where, depending on the state, votes appear to have been flipped from Gingrich, Ron Paul and Santorum to benefit Romney.
Article here by Michael Collins in Daily Censored 10/12
More, and in depth, from the same author: Daily Kos Nov., 2012 - Part 2 - Rigged Elections for Romney
(I can't tell if the author is still active over there)
Machines aside, much could be resolved readily by forensic examination of the paper ballots in GA and elsewhere - yet the SoS's in the states in contention have been uniformly resistant to transparency. How is *that*, rather than those demanding transparency and explanation for anomalies, what is casting doubt on the integrity of the election system?
Jovan H. Pulitzer offers definitive forensic determination about whether GA paper ballots were: printed or copied, folded or unfolded, filled out by human or machine. And to do it quickly and for *free* - GA election officials for some reason are not exactly jumping at the opportunity to have that happen:
The article on vote flipping in GA is seeming garbage
from the get go, and begs a ton of questions by elision. It isn't statistics, nor even good rhetoric.
Let's not start with a known 50-50 and then pull ten at a time. Let's just pull ten at a time and see if it turns out to be 50-50. The author uses this bullshit example of how things work to set the stage for a whole bunch of graphs that tell us nothing whatsoever about Georgia or about the recent election here in an attempt to make it seen that you can take the results from a tiny fraction of the populace and project it across the total p[opulation regardless of all underlying dishomogenous factors at work. That's not science and its not even statistics.
be well and have a good one.
That, in its essence, is fascism--ownership of government by an individual, by a group, or by any other controlling private power. -- Franklin D. Roosevelt --
Thanks for your comment.
I don't bother responding to blue anymore. He doesn't disprove what I write, because he can't. He just moves the goalposts and brings in more fantastical claims from from the "geniuses" on rightwing blogs.
Straw Man Bad
EDG - as has been pointed out to you by others than just myself, many, if not most of your "debunking" consists of knocking down straw men of your own making.
You thank EH for responding to me but fail to point out (notice?) that he clearly is either misunderstanding or misconstruing the graphs that I posted and misstates what the article on GA is about. Nor has (he?) bothered to respond, that having been pointed out to him.
By the way, are Daily Censored or Daily Kos (whose 2012 articles on Republican Primary vote-flipping I linked to) "right-wing blogs"? News to me, and no doubt a lot of other people.
I don't think the Georgia State Senate actually qualifies as a right-wing blog, either - that is whom Jovan Pulitzer was testifying to in the video I linked to. The subcommittee he was testifying before voted *unanimously* to have him proceed with a forensic examination,
Your last-ditch. limited hangout defense on electronic election fraud seems to be that 'well, even if it did happen, auditing/recounting paper ballots would catch it and that has not happened'. Short answer to that is "not necessarily". Especially if there are issues with chain of evidence, signature matching, unsupervised adjudication of rejected ballots, potential insertion of bogus printed/unfolded/etc. ballots.
Much clarity could be achieved by forensic examination of the paper ballots, which Pulitzer claims he can definitively do in a short time frame - and offered to do for *free* for Georgia - yet GA officials resist this as do nearly all of these contested states' governors and elected officials.
If there is nothing to hide, why are they making every attempt to avoid disclosure?
Pulitzer - just another Internet wacko?
His bio:
and Patent Archive
Jovan Pulitzer interviewed 13:00 to 32:00:
Good grief...
Your comment does not suggest that you are paying attention.
Neither the GA 2020 or WI 2012 graphs are extrapolating/projecting anything from a tiny sample, they each use totals from the official results for the entire state.
The x-axis for Georgia is by county from smallest (in number of votes cast) to largest - lines between dots indicate a county, the slope of the line between dots indicates how much and in what direction a county's returns shifted the overall percentages for each candidate.
The y-axis is the percentage vote for each candidate.
The x-axis for Wisconsin 2012 is the cumulative total from smallest to largest precinct.
The y-axis, as above, shows candidate percentages.
Hope that clarifies things.
There may indeed be problems with the studies cited, but it seems your comment fails produce any detectable readings on the Debunk-o-Meter. Feel free to try again, though.