Remember that Blow-Out wage growth? It's already gone
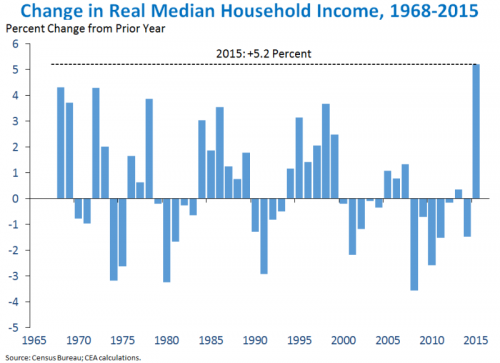
A couple months before the election, President Obama finally had something to brag about - median income had risen above the level they were at when he took office. He went on the campaign circuit for Hillary to tout those numbers.
“Republicans don’t like to hear good news right now,” Obama said in his campaign appearance for Hillary Clinton Tuesday, “but it’s important to understand this is a big deal.”
There is no doubt that the report was impressive. In fact, median income went up in 2015 by the most ever.

It's extremely impressive. There is just one big problem with the number - it isn't the official number.
The very next day when the official source, the Bureau of Labor Statistics, released their own report.
Average weekly wages for the nation decreased to $1,043, a 0.5 percent decrease, during the year ending in the first quarter of 2016. Among the 344 largest counties, 167 had over-the-year decreases in average weekly wages.
How in the Hell do you reconcile a) strongest median income growth in history, with b) falling average weekly wages?
Something is amiss.
Last week, the numbers didn't match up again.
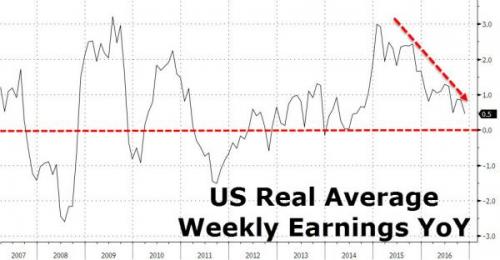
According to the November jobs report, average hourly earnings grew by 2.5% year-over-year, well below Bloomberg's consensus economists' expectations for a continued 2.8% growth rate.
And then today, the wage growth numbers were even more depressed.
US wages rose just 0.5% compared to last year.

If you dig into the numbers, it gets even worse.
In a separate report on Thursday, the Labor Department said private-sector U.S. workers saw a 0.3% decline in their inflation-adjusted weekly earnings in November compared with the prior month. Average hourly earnings fell 0.1%, prices rose 0.2% and the average workweek was unchanged from October.
So why do the official numbers show flat wage growth, while the Census numbers that Obama loved show wages rocketing higher?
The key to figuring this out is in the fine print.

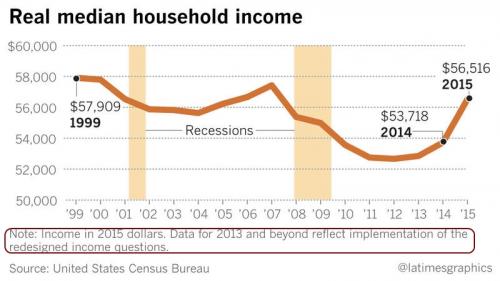
Note the bottom of that graph where it says "Redesigned income questions".
What does it mean?
Fortunately, someone else did the hard work for me.
The second knock is that Census moved the goal posts. Starting in 2013 with a partial phase-in, which was fully implemented in 2014, Census changed the questions and the methods in calculating household income.
For example, Census, starting in 2014, began to “collect the value of assets that generate income if the respondent is unsure of the income generated.”
Also, the government started to use “income ranges” as a follow-up for “don’t know” or “refused” answers on income-amount questions.
There are plenty of other changes — but with just these two, income levels reported could be noticeably higher, say 5.2 percent higher, without the actual income being 5.2 percent higher.
In the fine print, Census admits the change. “The data for 2013 and beyond reflect the implementation of the redesigned income questions.”
"Value of assets" is not the same as income. And if someone refuses to answer the income question, you don't fill in the answer for them.
It's not honest.
From what I can tell, this isn't actually a Census Report at all. It appears to be coming from Sentier Research, which is a private group contracted by the Census Bureau.
In reality, one third of Americans are hanging on by their fingernails.


Comments
Also it depends on how it is spread out. I would like to see
the data for relative earning and by sector.
1/3 of Americans are indeed just hanging on; 50% of families
have Zero wealth - they are Have-Nots. Obama is the "Bartender and Wait-Staff" president because that's where the jobs are being created(along with other low wage and precarious jobs).
Trump's publicity splash of saving 1000 Carrier jobs in Indiana costs taxpayers $7 Million and the company to "remain competitive with Mexico" is using that money, and more, to automate, thereby shedding jobs.
"The justness of individual land right is not justifiable to those to whom the land by right of first claim collectively belonged"
Don't you mean the "lucky ducks" who don't pay income tax?
Hillary's "basket of deplorables" are Mitt Romney's "45%"...
" In the beginning, the universe was created. This has made a lot of people very angry, and is generally considered to have been a bad move. -- Douglas Adams, The Hitch Hiker's Guide to the Galaxy "
Just dropped this on TOP
plus some more.
I wonder if they'll care?
Well now, "those people" deserve
this don't they? They didn't vote for Hillary so how dare they expect honest, actual wage growth. I'd bet money something to that effect is argued by the Shillbots.
Thank you so much for putting this together, I sent this on to my friends who still listen to MSM today, links and all. They can look for themselves and if they can't figure out just who is spewing fake news, well, I just don't know what more to say.
Only a fool lets someone else tell him who his enemy is. Assata Shakur
I suppose for shits and giggles --
you could give "puakev" a piece of your mind about cherry-picking Obamacare statistics.
"Trump is doing everything he can to make America the highest-cost economy in the world, and he’s succeeded." -- Michael Hudson
I half way suspect some of the people over there have someone
Else type their posts for them because there's a few over there who seem like they would be severely challenged just signing their name with an 'X'. They're so partisan it makes them stupid. Idol worship ain't necessarily a good thing.
I'm tired of this back-slapping "Isn't humanity neat?" bullshit. We're a virus with shoes, okay? That's all we are. - Bill Hicks
Politics is the entertainment branch of industry. - Frank Zappa
But, but, but
we don't have any real problems with fake news, do we? Nope, why the NYT is "independent" and purveys "real news." Such liars. Headline this morning bleating on about should Democrats try to appeal to white working class, or stick with the "diversity" issues they always use. So sickening.
Only a fool lets someone else tell him who his enemy is. Assata Shakur
They still have stuff they can sell...
So they aren't poor.
Correct me if I'm wrong, but wasn't this a Rethug Talking point?
I do not pretend I know what I do not know.
Of course they can sell stuff!
Body parts
That is so true.
During the depths of the recession, I sold my wedding ring for its scrap gold value. Bought us food for a few days.
Liberals suck.
They spent eight years worshiping a guy whose cabinet was chosen by a Citigroup executive and whose main achievements were a "health insurance" bill designed by Wellpoint with the help of the Heritage Foundation, a "sequester" intended as the first step toward a "grand bargain" that was the wet dream of the Peterson Foundation, and the Trans-Pacific Partnership designed to accelerate job flight out of the US and cement it with the surrender of US sovereignty.
And when Trump's in office the liberals will spend the next four years moaning about what would have happened had Clinton won, and campaigning for Cory Booker to replace the Donald.
"Trump is doing everything he can to make America the highest-cost economy in the world, and he’s succeeded." -- Michael Hudson
When have we ever been able to accept
government statistics with less than a boulder of salt?
"I can't understand why people are frightened of new ideas. I'm frightened of the old ones."
John Cage
It is the newest trend among democrats.
Blind acceptance of government authority including the CIA. Unless of course, you are a member of HYDRA Comrade.
It's a malaise blanketing the Democrats
A malaise of major proportions. Seeing the corruption like they've never seen it before, they are shell shocked and rendered impotent.
"I can't understand why people are frightened of new ideas. I'm frightened of the old ones."
John Cage
What I find puzzling
is how can wages be stagnate to falling while employment is full.
TPTB make up whatever numbers they want to tell a story.
I never knew that the term "Never Again" only pertained to
those born Jewish
"Antisemite used to be someone who didn't like Jews
now it's someone who Jews don't like"
Heard from Margaret Kimberley
Part of the story
Part of the story is that although unemployment is low, the labor participation rate is also low. In other words, a lot of people have given up looking for jobs or they are picking up short term jobs where they can and are not paying taxes. I know a number of people that do this. There are also a lot of undocumented aliens that probably do not participate in the employment survey.The real labor pool is much larger than the unemployment numbers indicate. Labor unions have been destroyed and manufacturing has been moved out of the country. Jobs paying decent wages have diminished in number and people are working in jobs that traditionally pay poorly.
I would say on all your points that
that is the whole story, they our fearless leaders spin the story every which way and what you wrote is the plain truth, we never hear the plain truth except from those you know "fake news" places.
It's sad.
I never knew that the term "Never Again" only pertained to
those born Jewish
"Antisemite used to be someone who didn't like Jews
now it's someone who Jews don't like"
Heard from Margaret Kimberley
Just anecdotally.
All the people who I know who got laid off and got jobs in their same field took significant pay cuts. One guy from from a very senior support engineer (with very complex software) to driving a van for very elderly people in group homes. Another guy who was doing complex IC layout is now making $16/hr doing basically substitute teaching for private schools. I have seen very little upward mobility in terms of wages for people I know in high tech. More often stagnant or pay cuts going either into the same job or non-related jobs. Could be different in the South Bay area, but my impression is lower wages and more stock.
The jobless recovery trashed many STEM workers
It is not just tech. I know a woman with an MS in engineering who became a grocery store clerk. Another older women got a job as a secretary/clerk at a small factory. Getting a job in biotech is also extremely difficult for older workers. Other science jobs are often filled by people with some sort of temporary visa.
Full-time university positions have disappeared. Anybody who did not have tenure in 2008 was at risk. It is difficult to make ends meet on adjunct professor pay.
It is not just a problem in STEM either. A friend of mine went from a law office to selling greeting cards.
Well, I have some experience with this.
Folks in my industry, in the Bay Area, are generally doing just fine. We're still not treated with respect or compensated adequately for the "value" extracted by the nouveaux aristocracy (VC, other banking), but overall I'd prioritize our needs with respect to the economy behind the needs of those who aren't as fortunate.
What I see is that outsourcing and "insourcing" with outsource (e.g. H1-B visa) shells is as big as ever. Also there are a lot of young (and not so young) very naive folks who think they're part of the next big "unicorn", and are willing to take lower wages in favor of "more" equity (which is pejoratively known around here as "lottery tickets"--although I think the lottery odds are generally better). Exploitation by the monied class is an issue, but not nearly at the same level or urgency as the issues folks in lower economic classes have.
Median vs Average
I saw an article about this weeks ago, but I'd forgotten about it because I don't believe any of the economic statistics anymore. As I was reading your essay, I expected you to say the difference was in "median" versus "average". The 5% chart is median, while the subsequent charts are all average. I don't know how much those usually diverge, but now I'm curious. I'd expect median to be lower than average, because of outsized inequality. Dunno.
That's median vs mean...
The word "Average" is actually an incredibly devious word to use if you want to massage numbers to get a desired result as it can generally be taken to refer to a mean value (add all values up, divide by number in sample) median value (half the values are above, half below) or even a mode (the most common number appearing in a sample - although this one is less used/useful)
Makes it a bit easier to look at a set of data and pick out the "average" which conveniently best supports your pre-ordained conclusion. Although as this case shows just changing your sampling methods is even more effective! (An honest outfit wouldn't change sampling methods AND still try to compare old values vs new values as though they were the same thing.)
i was a statistics major =)
arithmetic mean is generally understood to be the same as average, but its not a rigorous term
Reminds of the old adage
from statistics class.. If you torture the data long enough it will confess.
Some do better than others . . . surprise.
I captured some data. I think I will play with it to see if I can find something interesting.
Are those adjusted for inflation?
I knew that already but that graph is still stunning. The visual impact really brings it home.
I am not certain W.R.T. these particular numbers.
I suspect these particular numbers represent raw data (minimally cooked), at least that is the way I would have reported the study, but then that's the way I roll.
Using a simple search, this got highlighted:
Percent Change from Previous Year
If you are of the 90th percentile or above, the general pattern seems to be, your gains are larger and your loses are smaller than for those in the 20th percentile. Does that seem fair to you ? · · · to me, that just seems wrong.

So the old adage, "The rich get richer as the poor get poorer." seems to be supported by this data.
WA Minimum Wage Increase
Politicians never lie except when their mouths are moving. Since the charts aren't moving their mouths they cannot be lies. Your figures hint that someone may have been shall we say "bearing false witness'".
Meanwhile: The minimum wage in WA State goes to $11 an hour on January 1. Have already noticed small hikes in fast food joints in anticipation and I'm sure there are nickle and dime increases all over that I didn't notice but nothing to be alarmed by. With inflation stated today at just .02 per month the increase will be felt for quite a while and it increases upward by steps from here.
So it was "Real" Fake News then...
I've been looking through my pay stubs trying to figure out where the money was...
I'll stop looking for it...
The news seemed real coming from an official source and all...
I just don't know what to believe any more...
I'm the only person standing between Richard Nixon and the White House."
~John F. Kennedy~
Economic: -9.13, Social: -7.28,